

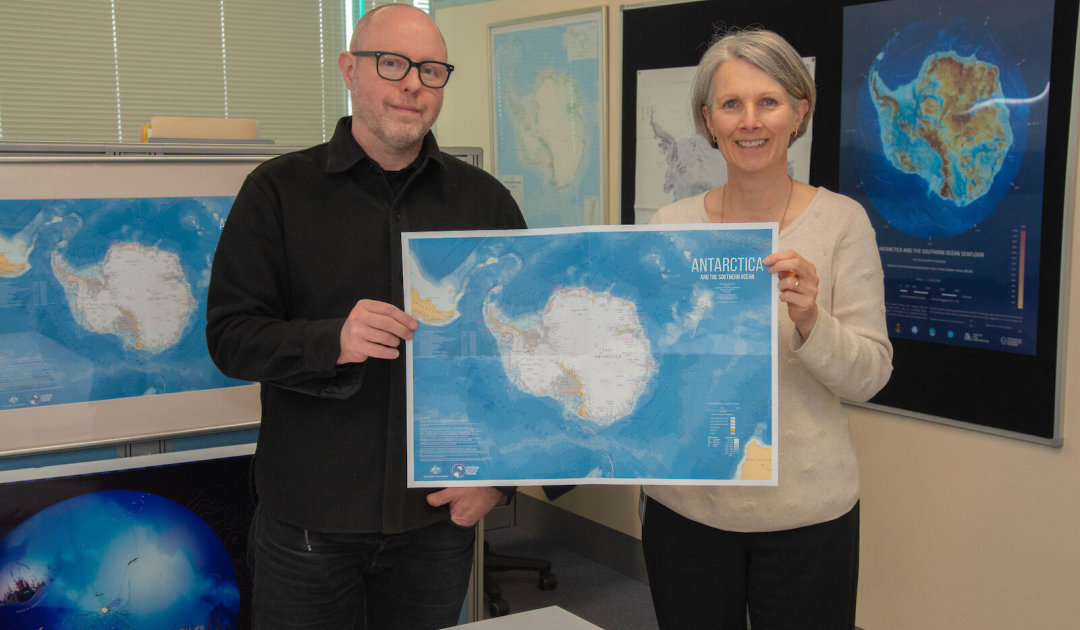
The Australian Antarctic Division (AAD), the Antarctic division of the Australian government, recently released the tenth edition of its Antarctic map – the most detailed of all the maps of Antarctica and the Southern Ocean produced by AAD to date.
Published at a scale of 1:20,000,000, the map shows in detail the topography, bathymetry as well as research stations with their corresponding names, mean ice extent and much more information. Unlike past editions, the last one was published in 2011, the new map was created using a Geographic Information System (GIS), which brings many new features and thus increases flexibility. Previous editions have been created photographically or with a graphics package.
Depending on requirements, the team can add additional datasets, such as the boundaries of the Commission for the Conservation of Antarctic Marine Living Resources (CCAMLR), or easily change colors and fonts and publish them as a new map, explains Ursula Harris, Mapping and Spatial Data Manager at AAD. Richard Mazurek, AAD’s Mapping Officer, adds that the GIS software “can be used to integrate a number of disparate data sets, from more sources than ever before.” For example, the background of the Antarctic continent is a combination of two data sets: the team used the latest REMA (Reference Elevation Model of Antarctica) data and underlaid it with LIMA (Landsat Image Mosaic of Antarctica) satellite imagery, Mazurek says.
“It’s fantastic to have a resource that we can provide as part of our outreach that shows people the scale of Antarctica and introduces them to Australia’s role as a leader in the region.”
Sachie Yasuda, Engagement Lead at AAD
In addition, shading of contours can now be done digitally in GIS, rather than having to be done by hand as in the past. “One of the tools we have allows us to effectively move the sun around and see what set of shadows looks best, to efficiently tease out the best looking surface for the map”, Mazurek describes.
However, the new map not only allows for best customization, but also takes into account international principles and procedures for naming places in Antarctica, with identifiers given in both English and the national language. “When we get a name from another country we keep the specific identifier but we translate the generic name into English. So you will notice on our map that the French name Terre Adélie is translated to Adélie Land,” Harris said. “The map has a very broad audience and will be widely distributed including internationally, so it is important that everyone understands what they are looking at.”
Julia Hager, PolarJournal
Link to the map (PDF): https://data.aad.gov.au/database/mapcat/20million/edition10/Antarctica_and_the_Southern_Ocean_15310.pdf
More on the subject:


Dear Sirs,
I would appreciate you inform me where I could to buy it?
Many thanks.
Dear Moises, the map is freely available. The link to the map is set at the end of the article.
Best Regards
The PolarJournal-Team
Hello,
I appreciate this map can be downloaded in a PDF version. However, wondering if it can be purchased as a print? Kindly advise.
With thanks,
Shayna
Dear Shayna,
thanks for your comment. To our knowledge, this map is available only via the download link. However, the actual size of the map and its resolution allow a fine print up to the size of A2 (42×59.5 cm).
If you are looking for other maps for purchasing, we suggest the chart and map shop (Australian) which has a similarly detailed map of Antarctica available on its website (https://www.chartandmapshop.com.au/antarctica-wall-map-revised-by-maps-international).
Thank you for following us.
Cheers from Switzerland
The PolarJournal Team