

Thawing permafrost in the Arctic is one of the most unmistakable signs that regions in the far north are undergoing climatic change. But there is a great deal of debate about the rates of thawing, the amounts of greenhouse gases that are escaping, and the consequences for Arctic ecosystems and Arctic residents, as opinions are widely held. A review study led by the German Alfred Wegener Institute AWI and Brigham Young University and an interactive map developed by AWI now clarify permafrost development in the Arctic.
Both works summarize the current state of knowledge around the past and future of permafrost and illustrate what is likely to happen under different model scenarios. They both conclude that only a massive reduction in greenhouse gas emissions can stop further warming of the Arctic, and with it the increasingly rapid and irreversible thawing of the permafrost. “There’s definitely more that we can do. We don’t have time for resignation,” explains Dr. Jens Strauss, head of AWI’s Permafrost Biogeochemistry Department and co-author of the international team’s summary study. This was published in the latest issue of the journal Frontiers in Environmental Science.

Permafrost makes up around ten percent of the Earth’s surface and has always been subject to a cycle of thawing and freezing in the Arctic. However, in recent decades, the thawing processes have gained massively in speed due to the warming of the Arctic and have prevented the soil from refreezing. This starts and accelerates decomposition processes in the soil, decomposing the organic material and releasing greenhouse gases such as carbon dioxide, methane and nitrous oxide. To reduce public uncertainty about how fast and how much this could be, Strauss and his colleagues have compiled the current state of knowledge in their study, showing a real picture on the subject.

«These people in the Arctic have done very little to cause climate change, but they’re particularly hard hit by it»
Dr. Jens Strauss, Alfred-Wegener-Institute
They conclude that the gigantic amounts predicted by some people will not be released in the next few years, but neither should politicians and society continue to downplay the problem. After all, in addition to greenhouse gases, the direct effects on humans, animals and plants from warming and thawing are an urgent problem that concerns everyone. Release of pollutants such as mercury, damage to infrastructure, displacement of adapted Arctic species, and loss of livelihoods are such problems. “These people in the Arctic have done very little to cause climate change, but are particularly hard hit by it,” says Jens Strauss.
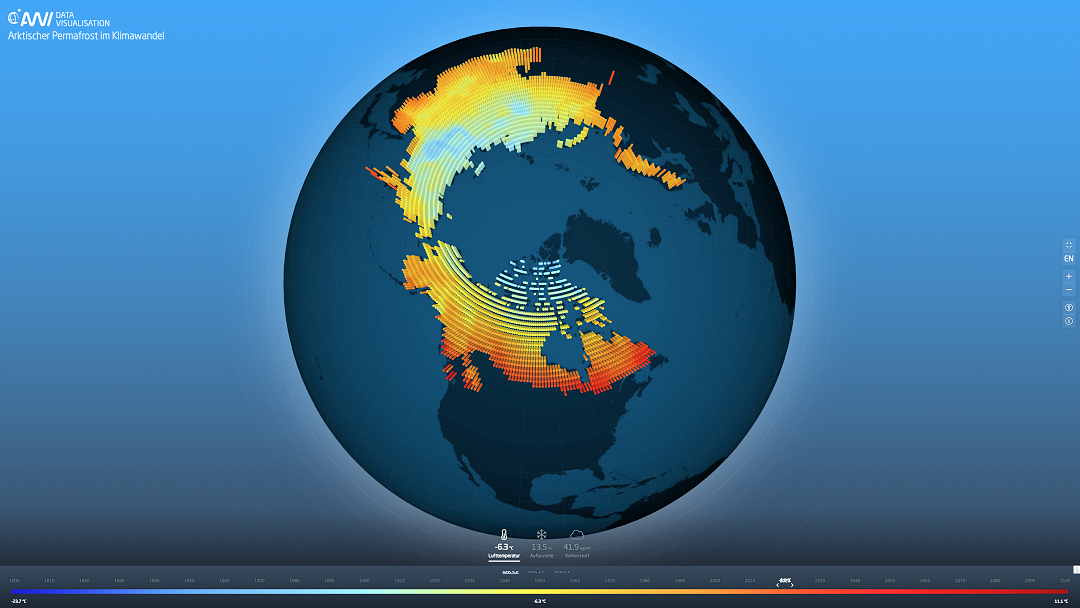
An interactive map developed by the AWI shows how fast and how large the melting of the permafrost soils in the Arctic will be. It shows not only the future, but also the past, i.e., the state before the thawing processes that are taking effect today. “Using the map, you can see how certain characteristics of the climate and permafrost have changed since the year 1800,” states Moritz Langer of the PermaRisk research group. He and his team collaborated with the University of Oslo, Humboldt University and the Technical University of Berlin to show how warm the surface has been at any given time since 1800, before the Industrial Revolution.
In addition, the map also displays forecasts for permafrost under the various emission scenarios. And it also shows that wish and reality are far apart, at least at present. After all, reducing emissions would actually limit the temperature rise to 2°C and thus stabilize permafrost. “Unfortunately, at the moment we are heading for a much stronger warming,” says Moritz Langer, and this would rather mean an increase of 4 – 6°C. What this means for the permafrost soils is clearly shown by the map to anyone who uses it: a not reassuring picture.
Dr. Michael Wenger, PolarJournal
Link to the study: Abbott et al (2022) Front Environ Sci (10) We Must Stop Fossil Fuel Emissions to Protect Permafrost Ecosystems ; https://doi.org/10.3389/fenvs.2022.889428
Link to the map study: Langer et al (2022) egusphere-2022-473 (pre-print) The evolution of Arctic permafrost over the last three centuries; https://doi.org/10.5194
More on the subject


