
While the trend graphs for the area and thickness of Arctic sea ice have been pointing downward for decades, sea ice around Antarctica has been much more variable. Record lows in minimum extent were followed by recurring record highs. But for eight years now, the curve has been following a downward trend in the southern hemisphere as well, and this year it will now reach an unprecedented record level.
Just 2.11 million square kilometers of ice still cover the nearshore waters around Antarctica, reports the German “Sea Ice Portal,” an expert forum of the Alfred Wegener Institute AWI and the University of Bremen. And the American experts at the National Snow and Ice Data Center in Boulder, Colorado, also report a record low of 1.91 million square kilometers, based also on their satellite data. This falls below the previous record low value of last year already a few weeks before the minimum extent value for Antarctic sea ice was published at the end of February. Since the period for the minimum extent is still until the beginning of March, the area is likely to become even smaller. However, the experts are not yet sure how low this value will go.
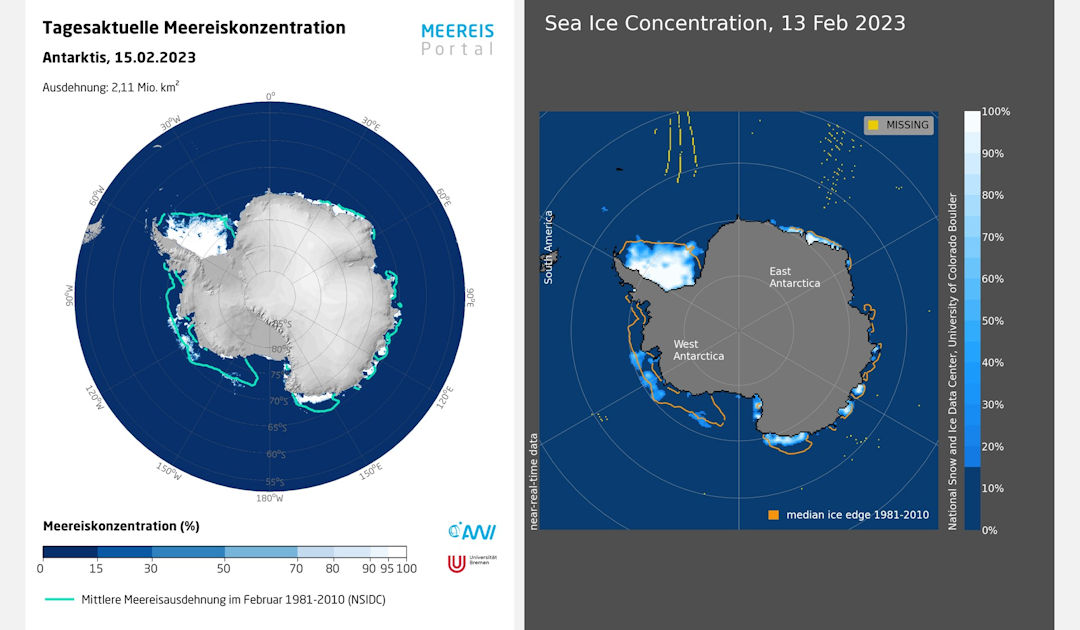
This year’s record figure continues the downward trend recorded for eight years. “The rapid decrease in sea ice over the last six years is very surprising because the ice cover had hardly changed in the previous thirty-five years,” Professor Christian Haas, a sea ice physicist at AWI, commented. In fact, data from U.S. colleagues show that since the start of satellite-based sea ice observations the ice extent has been fairly constant at first, and then began to increase in the early 2000s. Since 2016, however, the minimum extent has been steadily decreasing. And all sectors are now affected by this. The Ross Sea region in East Antarctica, which previously seemed rather stable, is also much more ice-free this year, and large parts of the Amundsen Sea, into which a large part of the West Antarctic Ice Sheet flows, is basically completely ice-free. A fact that is reflected in the numerous tourist ships that this year transit from South America to New Zealand with detours to the Ross Sea.


With the new record value and the steadily decreasing minimum extents, a new question arises for experts: “It is unclear whether this is the beginning of the rapid end of summer sea ice in Antarctica, or whether it is just a new phase with lower but still stable sea ice cover in summer,” explains Professor Haas. NSIDC data show that the linear trend since 1979 has been down just less than 1 percent, too little to be significant. But alarm bells have been ringing loudly due to the downfall since 2016.
Experts are not sure about the reasons why this drop in values is taking place right now, because the whole Antarctic system for sea ice formation and the necessary factors is highly complex. On the one hand, the expert teams blame changing wind patterns, which transported warmer air masses to the coasts of the Antarctic Peninsula. In addition, the very slightly warmer deep waters on the Antarctic continental shelf caused by climate change are being driven upward, leading to more rapid melting of the sea ice areas there. This upwelling is partly caused by the positive course of the Antarctic Oscillation, also known as SAM (Southern Annular Mode). This is a variation of air pressure in the area between the 40th parallel south and Antarctica. This year, the westerly wind belt around Antarctica is stronger and contracts strongly in the coastal region, which leads to a stronger upwelling of the deep currents there.
But solar radiation is also thought to be responsible for the fact that sea ice melts faster than it builds up. However, it is not really clear how the individual factors interact. The whole thing seems like a giant jigsaw puzzle, the pieces of which are apparent, but you haven’t really put them together yet.
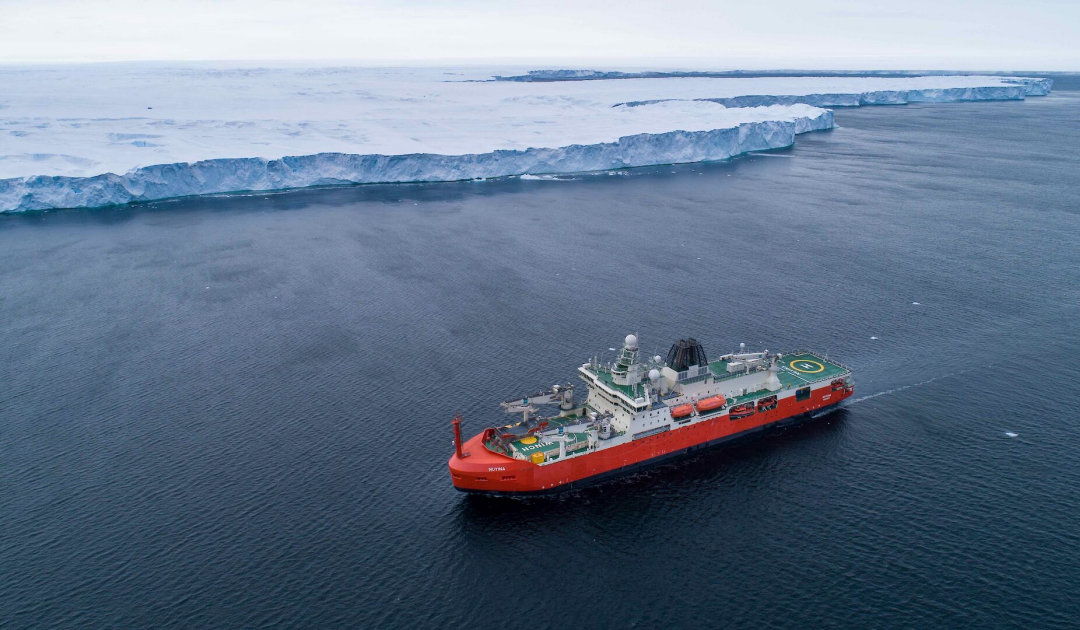
Researchers also agree that changing wind patterns around Antarctica play an important role in the current pattern of sea ice extent. That the SAM is affected by prevailing climate change is also supported by existing data. However, not all factors are known yet and there are still many unanswered questions, which researchers would like to answer now with high pressure. Because there’s a lag between the observations and the data recordings. On the one hand, this is due to the research stop in the past years due to the COVID pandemic, which prevented important field data from being recorded. On the other hand, this year of all years, the Australians are missing their most important platform, their research icebreaker Nuyina. The latter is currently stuck in Singapore due to technical problems and will almost certainly not be used again this season. This means that the important research cruise, the first in 10 years to deal with this very topic, is cancelled this year as well, and further important data that could have shed more light on the Antarctic sea ice are missing.
Dr Michael Wenger, PolarJournal
More on the topic


